
Page 83 - RUT Publisher
P. 83
Life Science Research and Sustainable Development ISBN: 978-98-84663-33-9
MATERIAL AND METHODS-
At various targeted Godavari river bank locales, including Paithan, Kaigaon, Gangakhad, and
Kopargaon, samples were gathered during various seasons. The right scientific techniques are
used to collect samples, which are put in plastic jars that have been cleansed with nitric acid and
distilled water prior to sampling. For the analytical study of heavy metals present in the collected
water samples, such as iron (Fe), copper (Cu), chromium (Cr), lead (Pb), cadmium (Cd), zinc (Zn),
and fluoride (F), the Atomic Adsorption Spectrophotometer (AAS) technique is utilised. It has
been identified in concentrations ranging from trace to large amounts.
RESULTS AND DISCUSSION-
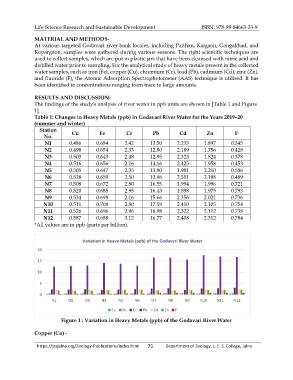
The findings of the study's analysis of river water in ppb units are shown in [Table 1 and Figure
1].
Table 1: Changes in Heavy Metals (ppb) in Godavari River Water for the Years 2019–20
(summer and winter)
Station Cu Fe Cr Pb Cd Zn F -
No.
N1 0.486 0.684 2.42 12.50 2.233 1.897 0.345
N2 0.498 0.654 2.33 12.80 2.189 1.756 0.428
N3 0.503 0.643 2.48 12.95 2.323 1.824 0.378
N4 0.516 0.656 2.16 14.16 2.425 1.958 0.453
N5 0.505 0.647 2.35 13.80 1.981 2.210 0.586
N6 0.528 0.659 2.50 12.96 2.351 2.198 0.489
N7 0.508 0.672 2.80 16.55 1.994 1.996 0.721
N8 0.520 0.685 2.95 16.43 1.898 1.975 0.793
N9 0.534 0.698 2.16 15.66 2.356 2.021 0.736
N10 0.511 0.708 2.80 17.58 2.410 2.105 0.754
N11 0.526 0.696 2.96 16.98 2.322 2.112 0.738
N12 0.587 0.688 3.12 16.77 2.408 2.312 0.784
*All values are in ppb (parts per billion).
Variation in Heavy Metals (ppb) of the Godavari River Water
20
15
10
5
0
N1 N2 N3 N4 N5 N6 N7 N8 N9 N10 N11 N12
Cu Fe Cr Pb Cd Zn F-
Figure 1 : Variation in Heavy Metals (ppb) of the Godavari River Water
Copper (Cu) -
https://jesjalna.org/Zoology-Publications/index.html 75 Department of Zoology, J. E. S. College, Jalna